We use cookies to give you the best experience possible. By continuing to use the site, you indicate that you accept cookies. See our cookies policy here.
Better Equipped Practical Teaching Guides
An enhanced A Level Physics practical guide to producing standing waves on a stretched string, identifying resonant modes and investigating how resonant frequency depends on vibrating length, tension and mass per unit length. The guide develops wave-speed calculations, linearised graph analysis, quantitative uncertainty, evaluation, troubleshooting, exam preparation and technician support.
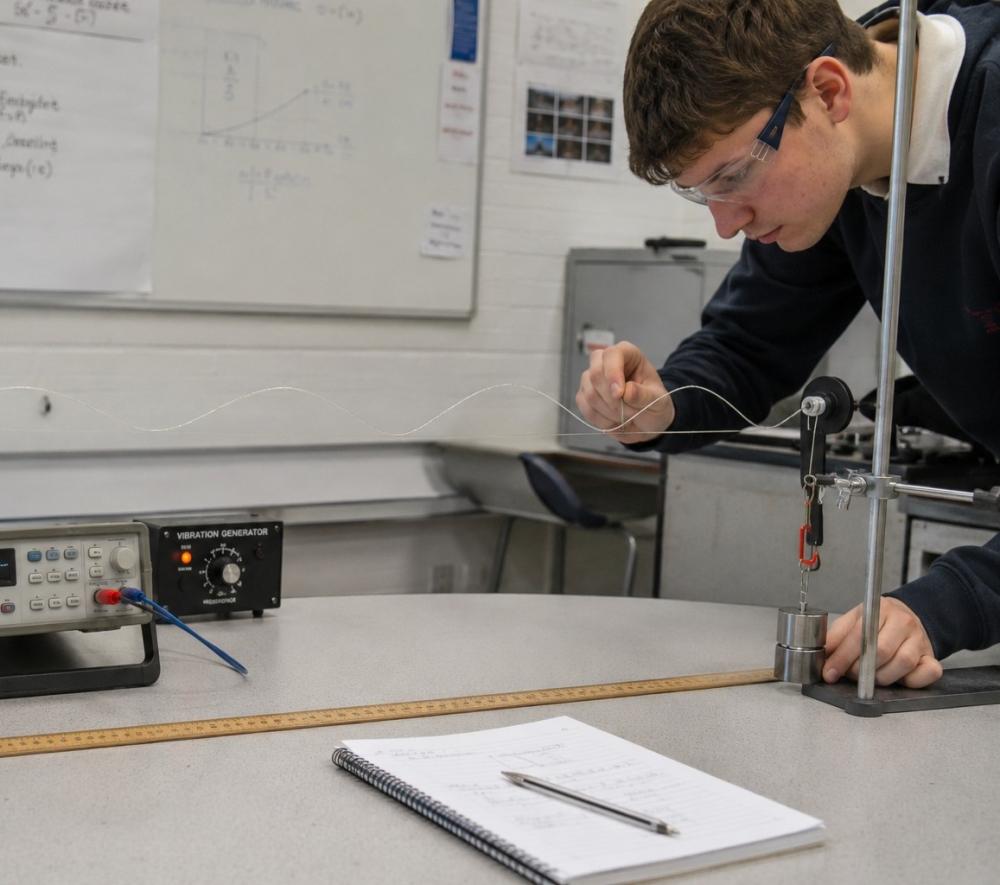
Teacher note: This resource is provided as a practical support guide to accompany laboratory equipment. Teachers should adapt procedures and risk assessments to suit their curriculum requirements, examination board specifications and local laboratory policies. Switch off the signal and vibration generators before touching the string, changing the hanging mass or adjusting the apparatus.
In this experiment, students produce standing - or stationary - waves on a stretched string or wire. They identify resonant modes and investigate how the resonant frequency depends on the vibrating length, L, the tension, T, and the mass per unit length, μ. Students also use the number of loops in the standing-wave pattern to determine wavelength and wave speed.
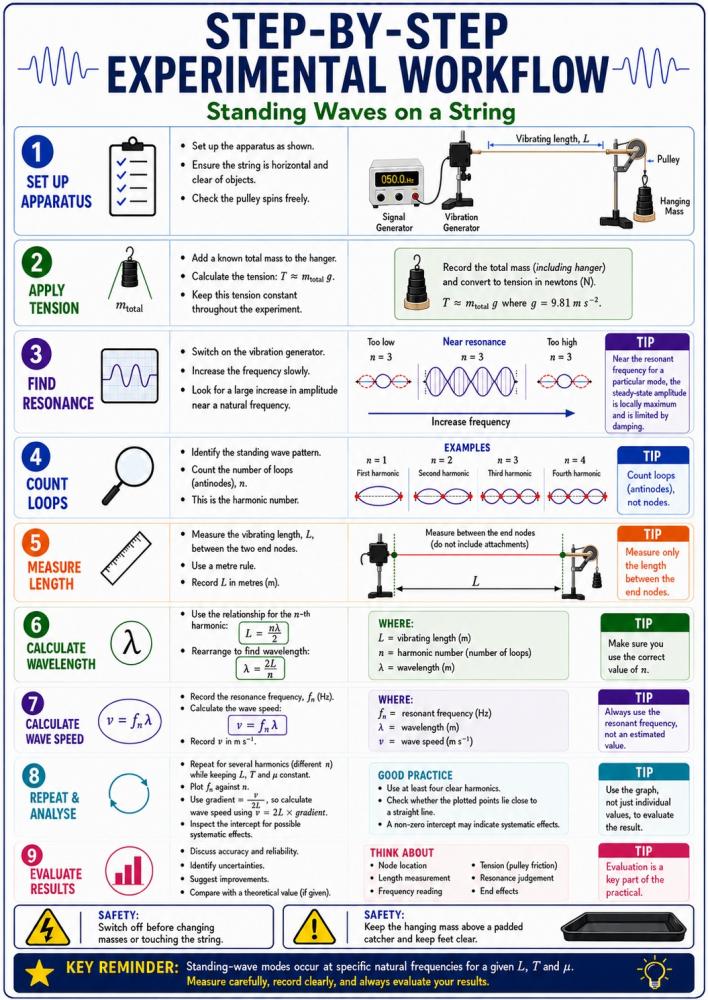
Core investigation: keep L, T and μ fixed, find at least four clear resonant modes, count the loops to assign the harmonic number n, approach each resonance from below and above, and use a graph of fn against n to determine wave speed from the gradient.
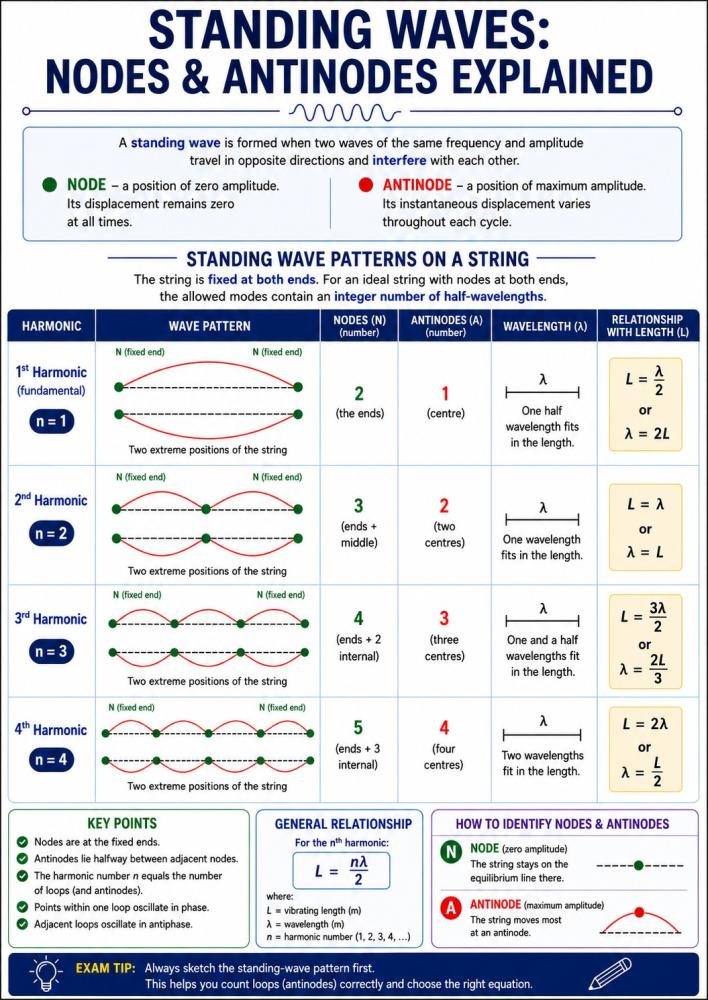
Standing waves make superposition and resonance directly observable. Waves travelling in opposite directions superpose to produce a stationary pattern containing nodes and antinodes.
At fixed T, μ and n: fn ∝ 1/L.
At fixed L, μ and n: fn ∝ √T, so fn2 ∝ T.
At fixed L, T and n: fn ∝ 1/√μ, so fn2 ∝ 1/μ.
At fixed L, T and μ: fn ∝ n.
A progressive wave transfers energy along a medium. For any wave, the wave speed is related to frequency and wavelength by v = fλ. Standing waves form by the superposition of two coherent progressive waves of the same frequency and equal amplitude travelling in opposite directions.
Key standing-wave relationships: λn = 2L/n | v = fλ | v = √(T/μ) | fn = (n/2L)√(T/μ)
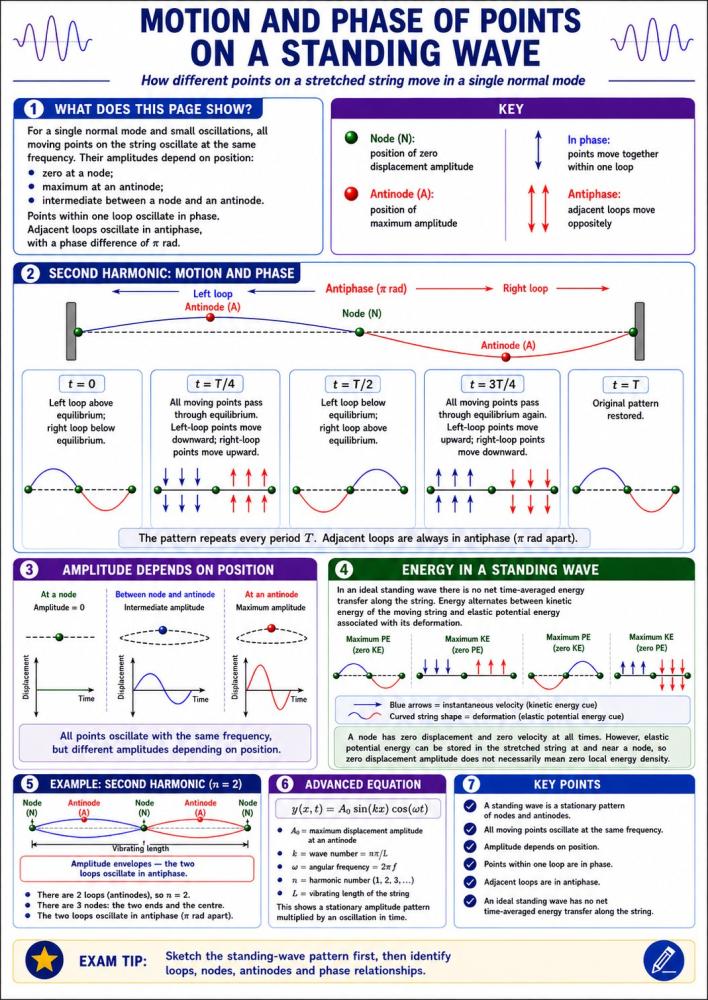
Nodes are positions of zero displacement amplitude. The effective vibrating length is measured between the two end nodes.
Antinodes are positions of maximum amplitude. The number of loops - or antinodes - equals the harmonic number n.
Points within the same loop oscillate in phase. Adjacent loops oscillate in antiphase, with a phase difference of π rad.
In an ideal standing wave there is no net time-averaged energy transfer along the string. In the real apparatus, the driver supplies energy and damping dissipates it.
| Harmonic | Loops / antinodes | Wavelength | Relationship to L |
|---|---|---|---|
| First, n = 1 | 1 | λ1 = 2L | L = λ1/2 |
| Second, n = 2 | 2 | λ2 = L | L = λ2 |
| Third, n = 3 | 3 | λ3 = 2L/3 | L = 3λ3/2 |
| Fourth, n = 4 | 4 | λ4 = L/2 | L = 2λ4 |
Model assumption: these relationships assume that the effective vibrating section has a node at each end and that end effects are negligible.
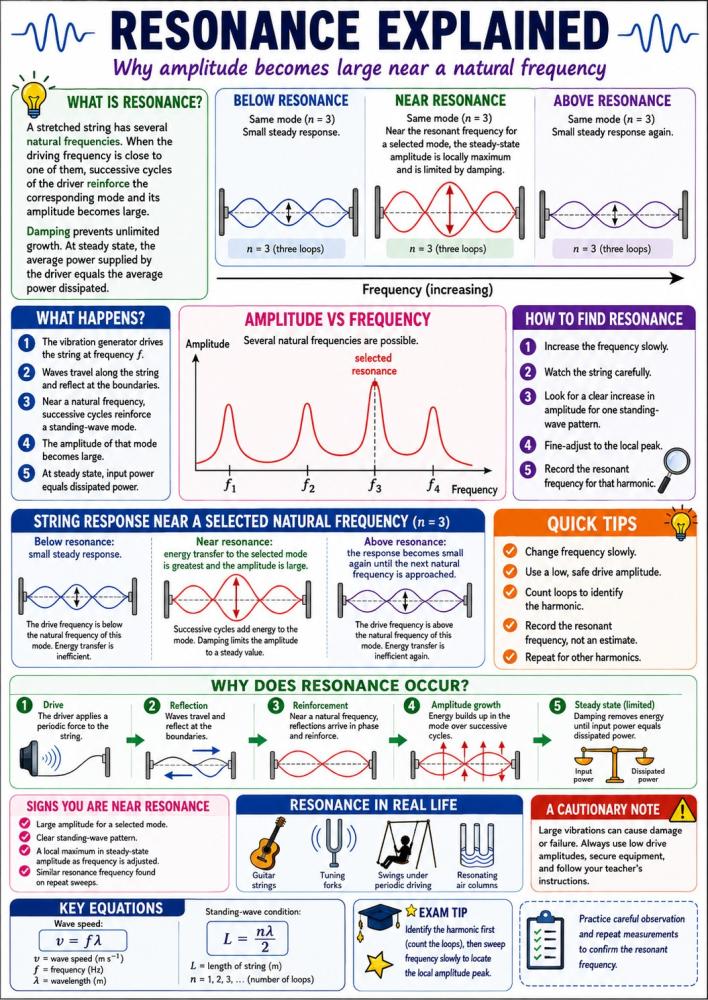
Resonance occurs when the driving frequency is close to one of the natural frequencies of the stretched string. Successive cycles of the driver reinforce the selected mode, so its steady-state amplitude becomes locally maximum. In the real apparatus, damping limits the amplitude.
| Variable changed | Quantities kept constant | Prediction |
|---|---|---|
| L | T, μ, n | fn ∝ 1/L |
| T | L, μ, n | fn ∝ √T, so fn2 ∝ T |
| μ | L, T, n | fn ∝ 1/√μ, so fn2 ∝ 1/μ |
| n | L, T, μ | fn ∝ n |
Equipment limit: use the lowest tension and driving amplitude that produce a clear pattern. Do not exceed the rated load of the vibration generator, string, pulley, mass hanger or supports.
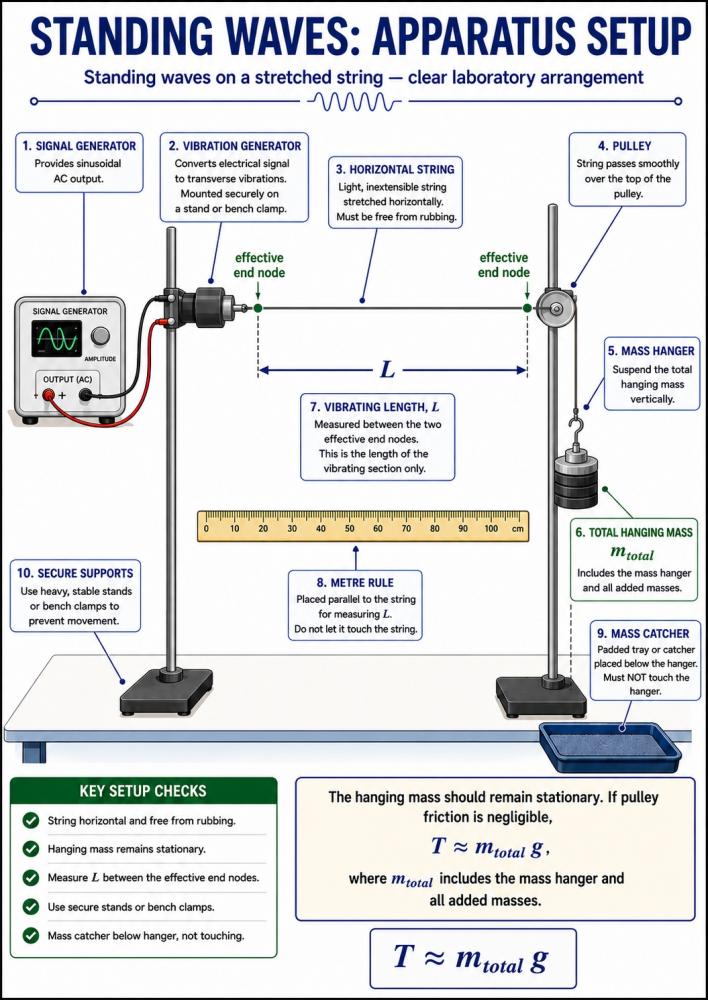
The core investigation finds several resonant modes while keeping the vibrating length, tension and linear mass density unchanged. The number of loops gives the harmonic number, n.
Examiner reminder: sketch and count the loops before assigning n. Then check that λn = 2L/n is consistent with the observed pattern.
| Observed harmonic n | Loops checked | f↑ / Hz | f↓ / Hz | Mean fn / Hz | λn = 2L/n / m | vn = fnλn / m s−1 |
|---|---|---|---|---|---|---|
String ID: ________ | μ = ________ kg m−1 | L = ________ m | mtotal = ________ kg | T = ________ N | estimated uncertainty in L = ________ m
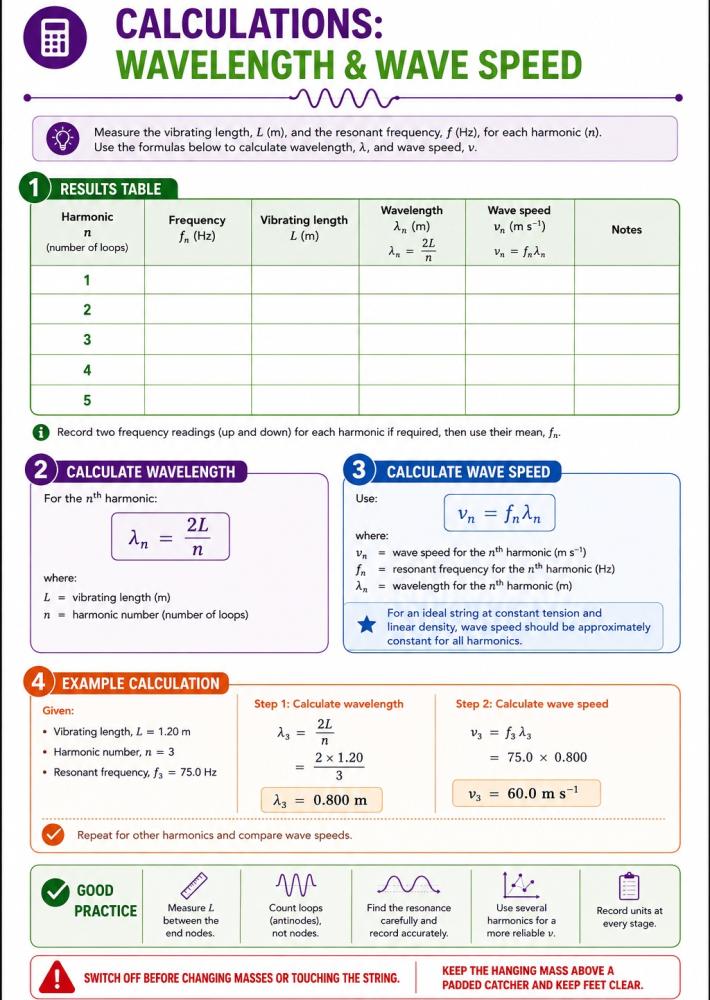
For the nth harmonic:
λn = 2L/n
Use the measured resonant frequency:
vn = fnλn
For fn against n:
v = 2L × gradient
Consistency check: for an ideal string at constant tension and linear density, individually calculated wave-speed values should be approximately constant for different harmonics. The guide recommends using the graph gradient as the primary final result and individual vn values as a check.
For each extension, select and retain one harmonic number n, use at least five values spanning a safe range, verify the loop count at every setting, approach each resonance from below and above, repeat measurements and calculate a mean frequency, and keep the drive-amplitude setting constant.
Keep T, μ and n constant. Change L using a moveable bridge or suitable adjustable support. Find the resonant frequency at each length.
Plot: fn against 1/L.
Expected relationship: fn ∝ 1/L.
Keep L, μ and n constant. Change the total hanging mass within the approved apparatus range. Use T ≈ mtotalg where pulley friction is negligible.
Plot: fn2 against T.
Expected relationship: fn2 = [n2/(4L2μ)]T.
Use strings or wires of different linear mass density. Determine each value using a long sample: μ = msample/lsample. Keep L, T and n constant.
Plot: fn2 against 1/μ.
Expected relationship: fn2 = [n2T/(4L2)](1/μ).
Safety and measurement note: record the balance and length-scale resolutions when determining μ. Switch off before changing the string, length or hanging mass. Use only centre-approved mass and frequency ranges within the ratings of the actual vibration generator, string, pulley, hanger and supports.
Use an unconstrained best-fit line. Although the theoretical relationship may pass through the origin, forcing an experimental line through the origin can hide end effects, pulley friction or a frequency offset.
Plot fn against n.
fn = (v/2L)n
Therefore v = 2L × gradient.
Plot fn against 1/L.
fn = (n/2)√(T/μ)(1/L).
Plot fn2 against T.
Expected gradient = n2/(4L2μ).
Plot fn2 against 1/μ.
Expected gradient = n2T/(4L2).
| Source | Why it matters | Improvement / response |
|---|---|---|
| Node location | The minimum-motion region has a finite width. | Estimate uncertainty from the width of the node region, not only the metre-rule scale. |
| Length | Both end-node positions contribute to uncertainty in L. | Use a longer vibrating length and include uncertainty from both end positions. |
| Frequency | A resonance peak has a finite width. | Average upward and downward sweeps or bracket the peak. |
| Tension | T ≈ mtotalg is only approximate when pulley friction is present. | Use a low-friction pulley or a force sensor to reduce or quantify the effect. |
| Linear density | A short string sample gives a large percentage uncertainty. | Measure the mass and length of a long sample. |
| End effects | Effective nodes may not coincide with physical attachment points. | Measure between effective end nodes and interpret any non-zero intercept. |
| Drive amplitude | Excessive drive can alter boundary behaviour and make the pattern unstable. | Use the lowest amplitude that produces a clear pattern and keep it constant. |
| String uniformity | Knots, fraying, stretching and non-uniform diameter change μ. | Inspect and replace damaged material; use a uniform sample. |
For v = 2Lf/n, with n counted exactly:
uv/v ≈ uL/L + uf/f
For v = √(T/μ):
uv/v ≈ ½(uT/T + uμ/μ)
| Problem | Possible causes | Safe response |
|---|---|---|
| No clear standing wave | Wrong frequency range; output too low; poor connection; string rubbing. | Check connections with power off, check alignment, then sweep frequency slowly. |
| Pattern unstable | Slightly off resonance; drive amplitude too large; loose clamp; mass bouncing. | Reduce amplitude, secure the apparatus and fine-adjust frequency. |
| String motion distorted | String rubbing on pulley; pulley misaligned; damaged string. | Switch off, realign and inspect the string and pulley. |
| Hanging mass oscillates | Excessive drive amplitude or unsuitable tension. | Switch off, support the hanger, reduce drive and check the approved mass. |
| String or wire breaks | Damage, excessive tension or a sharp contact point. | Switch off immediately, keep clear of falling masses, support and remove the hanger, replace the string and inspect the apparatus before restarting. |
| Calculated v changes strongly with n | Wrong loop count; wrong L; poor resonance judgement; end effects. | Sketch each pattern, remeasure between nodes and use a best-fit graph. |
“Standing waves travel along the string.”
The standing-wave pattern does not travel along the string, although it is formed from progressive component waves travelling in opposite directions.
“Nodes are points of maximum vibration.”
A node is a position of zero amplitude; an antinode is a position of maximum amplitude.
“Increasing frequency always increases wave speed.”
For a given string at fixed T and μ, changing the generator frequency changes the resonant mode and wavelength; it does not significantly change the propagation speed.
“Resonance occurs at any frequency.”
Resonance occurs only near the natural frequencies of the stretched string.
“A standing wave transfers no energy anywhere.”
In an ideal standing wave there is no net time-averaged energy transfer along the string. In the real apparatus the driver supplies energy that is dissipated through damping.
| Lesson 1 activity | Time | Lesson 2 activity | Time |
|---|---|---|---|
| Safety, theory and apparatus demonstration | 10 min | Planning variables and risks | 10 min |
| Setup and checks | 10 min | Investigate one of L, T or μ | 30 min |
| Find at least four resonant modes | 20 min | Process and graph data | 15 min |
| Calculate λ and v | 10 min | Evaluation and conclusions | 5 min |
| Plot fn against n and evaluate | 10 min |
Students can demonstrate correct identification of nodes and antinodes, recognition of resonance, wavelength measurement, harmonic relationships, wave-speed calculations, graphical analysis, quantitative uncertainty, safe working, variable control, anomaly identification and maintenance of an individual contemporaneous practical record.
The guide provides model risk-assessment information only. Complete the final centre assessment using the actual equipment ratings, approved string or wire, maximum total hanging mass, frequency and drive-amplitude limits, manufacturer instructions and local procedures. Assign an overall risk rating only after these factors have been reviewed.
| Hazard / source | Possible harm | Control measures | Emergency action |
|---|---|---|---|
| Falling mass hanger or slotted masses | Foot or impact injury; damaged floor or apparatus. | Secure pulley and stand; use a locking hanger; place a padded catcher just below the lowest expected position without supporting the hanger; keep feet clear; support the hanger while changing masses; switch off before adjustments. | Switch off and isolate apparatus; keep others clear; provide first aid; report and inspect apparatus before reuse. |
| Tensioned string or wire snapping | Recoil injury; eye injury; cuts from wire. | Inspect before use; use the lowest effective tension; do not exceed ratings; keep faces away from the line of the string; use eye protection where required; replace damaged material immediately. | Switch off; do not handle sharp wire with bare hands; provide first aid; dispose of broken wire in an approved sharps container. |
| Moving string and vibration generator | Fingers, hair or clothing caught; minor impact. | Keep hands clear while running; tie back long hair; secure loose clothing; switch off before touching the string or changing the setup. | Switch off immediately; free the person without pulling against moving apparatus; seek first aid where required. |
| Unstable stands or pulley support | Apparatus toppling; crush or pinch injury. | Use heavy bases or bench clamps; keep the overhanging mass close to the bench; tighten bosses and clamps; keep equipment away from an unprotected edge. | Keep clear of falling equipment; provide first aid; remove damaged apparatus from service. |
| Electrical equipment and leads | Electric shock from damaged equipment; overheating. | Use approved low-voltage equipment; inspect leads and plugs; keep equipment dry; make connections with power off; do not use damaged equipment. | Isolate the supply; do not touch exposed conductors; report the fault and follow local electrical emergency procedures. |
| Trailing leads | Trips and falls. | Route leads away from walkways; shorten, secure or cover them; keep bags clear. | Stop work, make the area safe and provide first aid. |
| Stroboscope, if used | Headache, dizziness or photosensitive reaction. | Use only after a separate centre assessment; warn users; do not expose anyone known to be susceptible; minimise duration and avoid unnecessary viewing. | Stop the stroboscope immediately; assist the affected person and follow the centre’s medical response procedure. |
The first resonance found during a sweep may not be n = 1. Count the loops in the pattern: the number of loops equals the harmonic number.
The standing-wave relationship L = nλ/2 applies to the vibrating section between boundary nodes. Measuring to physical attachment points can introduce a systematic error.
A resonance has a finite width. Recording values from upward and downward sweeps and taking their mean reduces uncertainty in judging the peak frequency.
T ≈ mtotalg assumes the hanging mass is stationary and pulley friction is negligible. Pulley friction can make the horizontal string tension differ from the nominal value.
Several modes provide multiple points for a graph of fn against n. The gradient gives a more reliable wave speed and the intercept and scatter help reveal experimental limitations.
A non-zero intercept can contain useful evidence of end effects, pulley friction, a frequency offset or incorrectly assigned harmonics. Forcing the line through zero can hide these effects.
Weighing too short a string sample produces a large percentage uncertainty. A longer sample reduces the relative effect of balance and length-scale resolution.
Explore more practical-science equipment, laboratory planning support and related physics practical work from Better Equipped.
This guide was written and reviewed by Better Equipped's technical team and further reviewed by former A Level Science Teachers. Our technical team draw on experience supplying practical science equipment to schools, colleges, laboratories and science departments throughout the UK. They include ex-school laboratory technicians and are here to support schools, colleges and laboratories. If you have feedback on this guide, we'd love to here it so please contact us. Don't forget we will be regularly updating our guides and resources on our Better-Resources Hub. If you would like us to cover a particular subject matter in these guides or have some top tips you'd like to share then again we'd love to hear from you.
Last reviewed and updated: August 2026
Browse equipment for standing-wave and resonance practicals, including signal generators, vibration equipment, masses, stands, clamps, metre rules and general A Level Physics laboratory equipment.



 Call us:
 Email us: